
InfluxDB
Purpose-built time-series database optimized for high-speed ingestion and querying of timestamped data. InfluxDB 3, rewritten in Rust on Apache Arrow and Parquet, supports SQL and InfluxQL natively with unlimited cardinality.
Most manufacturing data is time-series data: sensor readings, machine cycle times, energy consumption, vibration measurements. General-purpose databases can store it, but they struggle with the write volumes and time-range queries that factory floors generate. InfluxDB exists specifically for this workload. It has been the default time-series database in the MING stack (Mosquitto + InfluxDB + Node-RED + Grafana) since the early days of open-source IIoT, and it remains the most widely deployed option in that role, with over 31,000 GitHub stars and 1 billion+ Docker Hub pulls.
Key features
- SQL and InfluxQL queries — InfluxDB 3 supports standard SQL alongside its original InfluxQL, so teams comfortable with SQL don't need to learn a new query language.
- Unlimited cardinality — v3 removed the cardinality limits that plagued v2 deployments with many unique tag combinations (a common problem when tagging data by machine ID, line, and shift).
- Apache Arrow and Parquet — the storage engine uses columnar Parquet files and Arrow for in-memory processing, which means analytical queries over large time ranges run significantly faster than in v2.
- Telegraf collector ecosystem — InfluxData's Telegraf agent ships with 300+ input plugins including OPC-UA, Modbus TCP/RTU, MQTT, S7, and SNMP, covering most industrial protocols out of the box.
- Line Protocol ingestion — a simple text-based wire protocol that makes writing data from scripts, PLCs, and edge devices straightforward. Widely supported by third-party tools.
- Edge-to-cloud replication — InfluxDB can run on edge devices (including ARM) and replicate data to a central instance or InfluxDB Cloud, useful for multi-site manufacturing setups.
What InfluxDB does
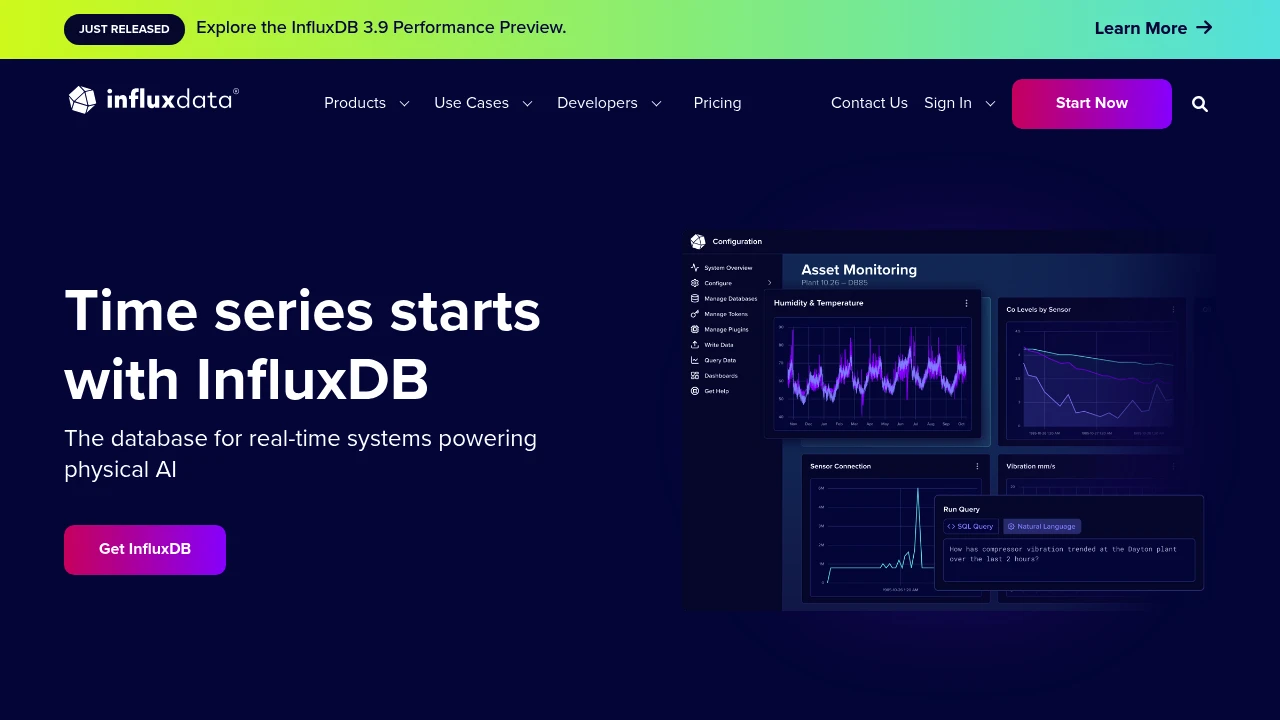
InfluxDB is a storage and query engine for time-series data. You write timestamped points (a measurement name, tags for metadata, and fields for values), and it handles compaction, indexing, and retention policies automatically. The typical manufacturing deployment looks like: sensors and PLCs feed data through Telegraf (or direct HTTP/Line Protocol writes) into InfluxDB, which Grafana or custom dashboards then query for visualization.
InfluxDB 3 is a ground-up rewrite in Rust, replacing the Go-based v2 engine. The new architecture separates compute from storage, uses Apache DataFusion as its query engine, and stores data as Parquet files. This matters for manufacturing because it handles the high-cardinality workloads (thousands of unique sensor tags) that caused performance issues in v2. The trade-off is that v3 Core is still maturing, and some v2 features like built-in dashboards (Chronograf) and the task/alerting system haven't been ported over.
There are three deployment tiers: InfluxDB 3 Core (open source, Apache 2.0/MIT) for single-node deployments, InfluxDB 3 Enterprise for clustering, compaction, and HA (commercial license, free for non-commercial use), and InfluxDB Cloud (fully managed SaaS).
Why choose InfluxDB
The MING stack standard. InfluxDB is the "I" in the MING stack that has become the de facto open-source monitoring starter kit for manufacturing. If you follow any IIoT tutorial, InfluxDB is likely part of it. That translates into more documentation, more examples, and more people who can help you troubleshoot.
Telegraf's industrial coverage. The Telegraf agent is the real workhorse for industrial deployments. Its OPC-UA, Modbus, and MQTT plugins mean you can collect data from Siemens, Rockwell, Beckhoff, and other PLCs without writing custom code. Bosch Rexroth ships Telegraf as a ctrlX AUTOMATION app for direct integration with their controllers.
Proven at scale in industry. MAN Energy Solutions (now Everllence) runs its MAN CEON platform on InfluxDB to analyze billions of readings from large-scale engines. Bosch Rexroth uses it on ctrlX CORE devices for edge-to-cloud machine monitoring. These aren't pilot projects.
No vendor lock-in on data. Data stored as Parquet files means you can query it with any tool that reads Parquet (DuckDB, Spark, Pandas) even without InfluxDB running.
Getting started
Install InfluxDB 3 Core via Docker (docker run influxdb:3-core), a single binary, or apt/yum packages. It runs on Linux, macOS, and ARM devices. Write your first data point with a curl command using Line Protocol, then query it with SQL. The whole process takes under 15 minutes.
For a factory pilot, the typical path is: install InfluxDB + Telegraf on a spare machine or Raspberry Pi, configure Telegraf's Modbus or OPC-UA plugin to read from one machine, point Grafana at InfluxDB, and you have real-time machine monitoring in an afternoon. The MING stack tutorials on the InfluxData blog and community forums walk through this step by step.
Learning curve is moderate. If you know SQL, querying is straightforward. The concepts that take time are retention policies, continuous queries (v2) or materialized views (Enterprise only in v3), and tuning Telegraf for high-frequency collection. The InfluxData community forum and Slack are active, and questions typically get responses within a day.
Technical specs
- Languages: Rust (v3 engine), Go (Telegraf, CLI tools)
- Storage: Apache Parquet files on local disk or S3-compatible object storage
- Query engines: Apache DataFusion (SQL), InfluxQL parser
- Wire protocols: Line Protocol (HTTP/TCP), Flight SQL (gRPC), REST API
- Minimum hardware: 2 CPU cores, 4 GB RAM, SSD recommended. Runs on ARM (Raspberry Pi 4+).
- OS: Linux (primary), macOS, Windows (community). Official Docker images for amd64 and arm64.
Limitations
-
InfluxDB 3 Core is single-node only. No clustering, no high availability, no read replicas. If you need HA, you need Enterprise (commercial) or a proxy/load balancer setup. For a single-line pilot this is fine; for a plant-wide deployment, it is a real constraint.
-
No built-in visualization or alerting. Unlike v2 which bundled Chronograf and a task engine, v3 Core is a pure database. You need Grafana (or similar) for dashboards and a separate tool for alerting. This is actually fine for most deployments since Grafana is better at visualization anyway, but it means more moving parts to manage.
-
Compaction requires Enterprise. Core writes data in 10-minute Parquet blocks. Without the Enterprise compactor, queries spanning weeks or months scan many small files, which degrades performance. The original 72-hour query limit has been lifted, but long-range queries on Core are still slower than on Enterprise or competitors with built-in compaction.
-
v2 to v3 migration is not seamless. The rewrite changed the storage engine, query language defaults, and API surface. Existing v2 deployments can't upgrade in place. InfluxData provides migration tooling, but it requires planning, especially if you relied on Flux (the v2 query language, which is deprecated in v3).
-
Telegraf adds operational complexity. While Telegraf's plugin ecosystem is a strength, running and configuring Telegraf agents across many machines adds operational overhead. Each agent needs its own config file, monitoring, and updates.
Integrates with
 MosquittoInfluxDB
Mosquitto publishes MQTT messages that Telegraf (InfluxData's collection agent, part of the InfluxDB ecosystem) subscribes to and writes into InfluxDB. Telegraf acts as the bridge — it's a standalone agent from InfluxData that collects metrics from 300+ sources, including MQTT brokers, and writes them to InfluxDB. This Mosquitto → Telegraf → InfluxDB pipeline is the data ingestion path in the MING stack.
 GrafanaInfluxDB
Grafana reads from InfluxDB via Flux queries
- Kind
- Software
- Vendor
- InfluxData
- License
- Open Source
- Website
- www.influxdata.com ↗

More from InfluxData
Similar to InfluxDB


